


MakeGraph
Free online chart maker
What is MakeGraph?
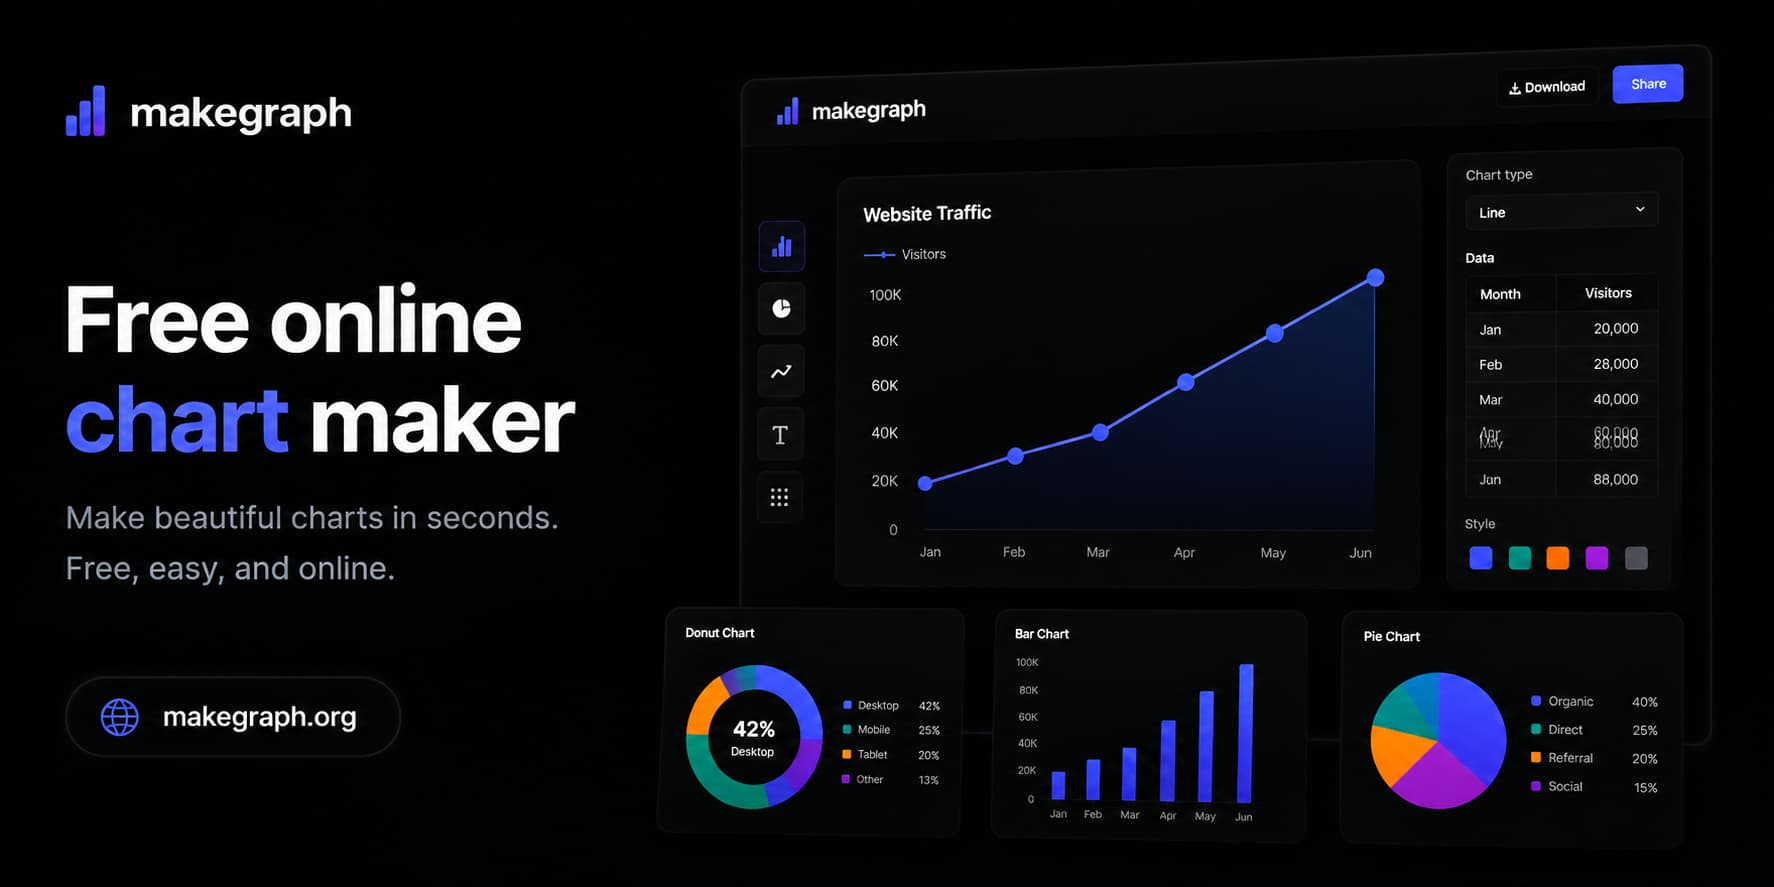
MakeGraph is a free online chart maker for spreadsheet data. Users upload or paste Excel or CSV data and generate bar, line, pie, scatter, radar, area, and correlation-matrix charts, then export them as PNG or SVG. It requires no signup or registration.
What can MakeGraph do?
- 01
Line Chart
Plots trends over time with custom labels and colors.
- 02
Bar Chart
Creates bar graphs for category comparisons.
- 03
Scatter Chart
Plots relationships between two numeric variables.
- 04
Correlation Matrix
Builds a heatmap of metric relationships for reports.
- 05
Confidence Interval Area
Shades an uncertainty band around an estimate line.
- 06
Export PNG or SVG
Exports finished charts as PNG or SVG instantly.
Use Cases
- Analyst — An analyst pastes CSV data and exports a bar chart for a report.
- Student — A student generates a scatter chart from spreadsheet data without signing up.
Quick facts about MakeGraph
- Domain Rating
- Platforms
- Web
MakeGraph Traffic Analysis
Alternatives to MakeGraph
Looking for a MakeGraph alternative? Compare these curated AI tools that offer similar features and use cases.

Claude Design
Claude Design is an Anthropic Labs product that turns text, images, documents, and website captures into polished visual work — designs, interactive prototypes, pitch decks, one-pagers, and marketing collateral — powered by Claude Opus 4.7's vision model.

Canva
Canva is a web and mobile design platform combining drag-and-drop templates, brand kits, and AI generators so non-designers can produce social posts, presentations, videos, and marketing assets without specialist software.

Leonardo.Ai
Leonardo.Ai is a generative AI platform for creating images, art, and video assets. It offers developer APIs and team tools for marketing and design workflows.