

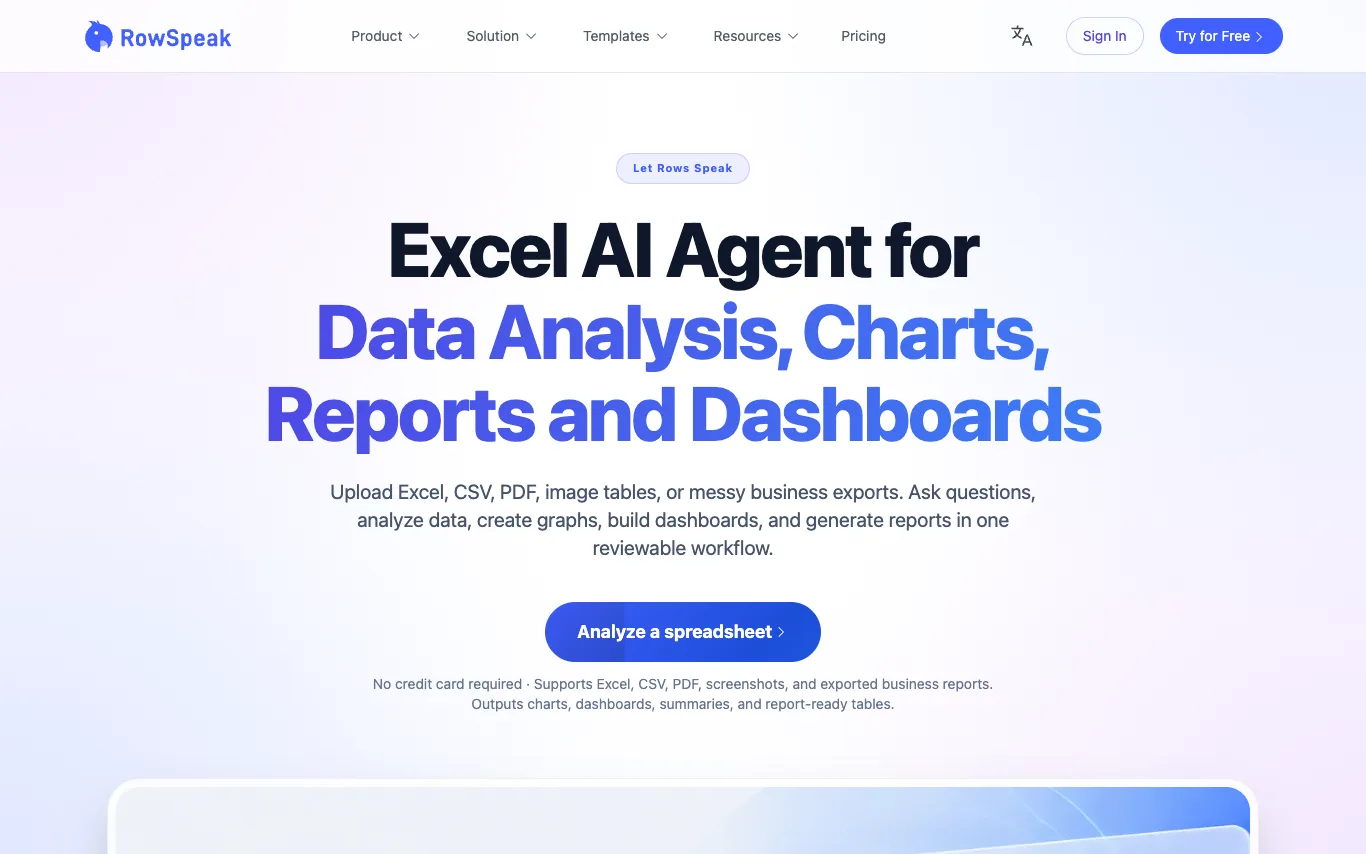

RowSpeak is an Excel AI agent that analyzes messy Excel, CSV, PDF, and image tables. It helps users find trends, explain changes, and create charts, dashboards, and reports. The platform supports natural language queries, data cleaning, and repeatable workflows, making it suitable for business teams.
AI Charting · 1 tools
Best AI Charting Tools (2026)
Compare AI charting tools that turn raw data or a plain-language prompt into charts, dashboards, and infographics — from spreadsheet add-ons to no-code data-viz generators.
All AI Charting tools
What is an AI charting tool?
An AI charting tool turns raw data or a plain-language request into a finished chart, graph, or dashboard. You paste a spreadsheet, connect a database, or just describe what you want to see, and it picks a chart type, maps the fields, and styles the result. Many also read the data back to you in words, flagging trends and outliers you might miss.
What these tools do
- Turn a text prompt into a ready chart
- Import CSV, Excel, Google Sheets, or databases
- Auto-suggest the fitting chart type
- Plain-language summaries of trends and outliers
- Interactive dashboards with filters and drill-down
- Export to PNG, SVG, embed, or slides
Who uses AI charting tools
01
Analysts and data teams
Explore a dataset fast and generate first-draft visuals before building the polished report.
02
Founders and marketers
Turn metrics into clear dashboards and shareable graphics without waiting on an analyst.
03
Students and researchers
Chart survey results or experiment data and get a plain-language read of what it shows.
04
Report and slide builders
Drop clean, on-brand charts straight into presentations, documents, and client decks.
How it works
The tool profiles your data — column types, ranges, and relationships — then a language model interprets your request to choose the encoding: axes, series, colors, and chart type. It generates the visualization, often on top of a library like D3, Vega, or ECharts, and lets you refine it by asking in words. Some connect live to a source so the chart updates as the data changes.